WIND RIVER STUDIO
Platform Health
Wind River Studio Platform Health provides a real-time view into the status of each capability or service required for Studio to operate.
Platform Health quickly and accurately informs users about issues related to the platform.
Platform health is determined through analysis of telemetry collected from various mechanisms within the container platform and does not add any overhead to individual components. Information collected within this mechanism can also be made available via API for the purposes of scaling and capacity planning.
Wind River Studio Platform Health Solutions
Customizable and Configurable Dashboards
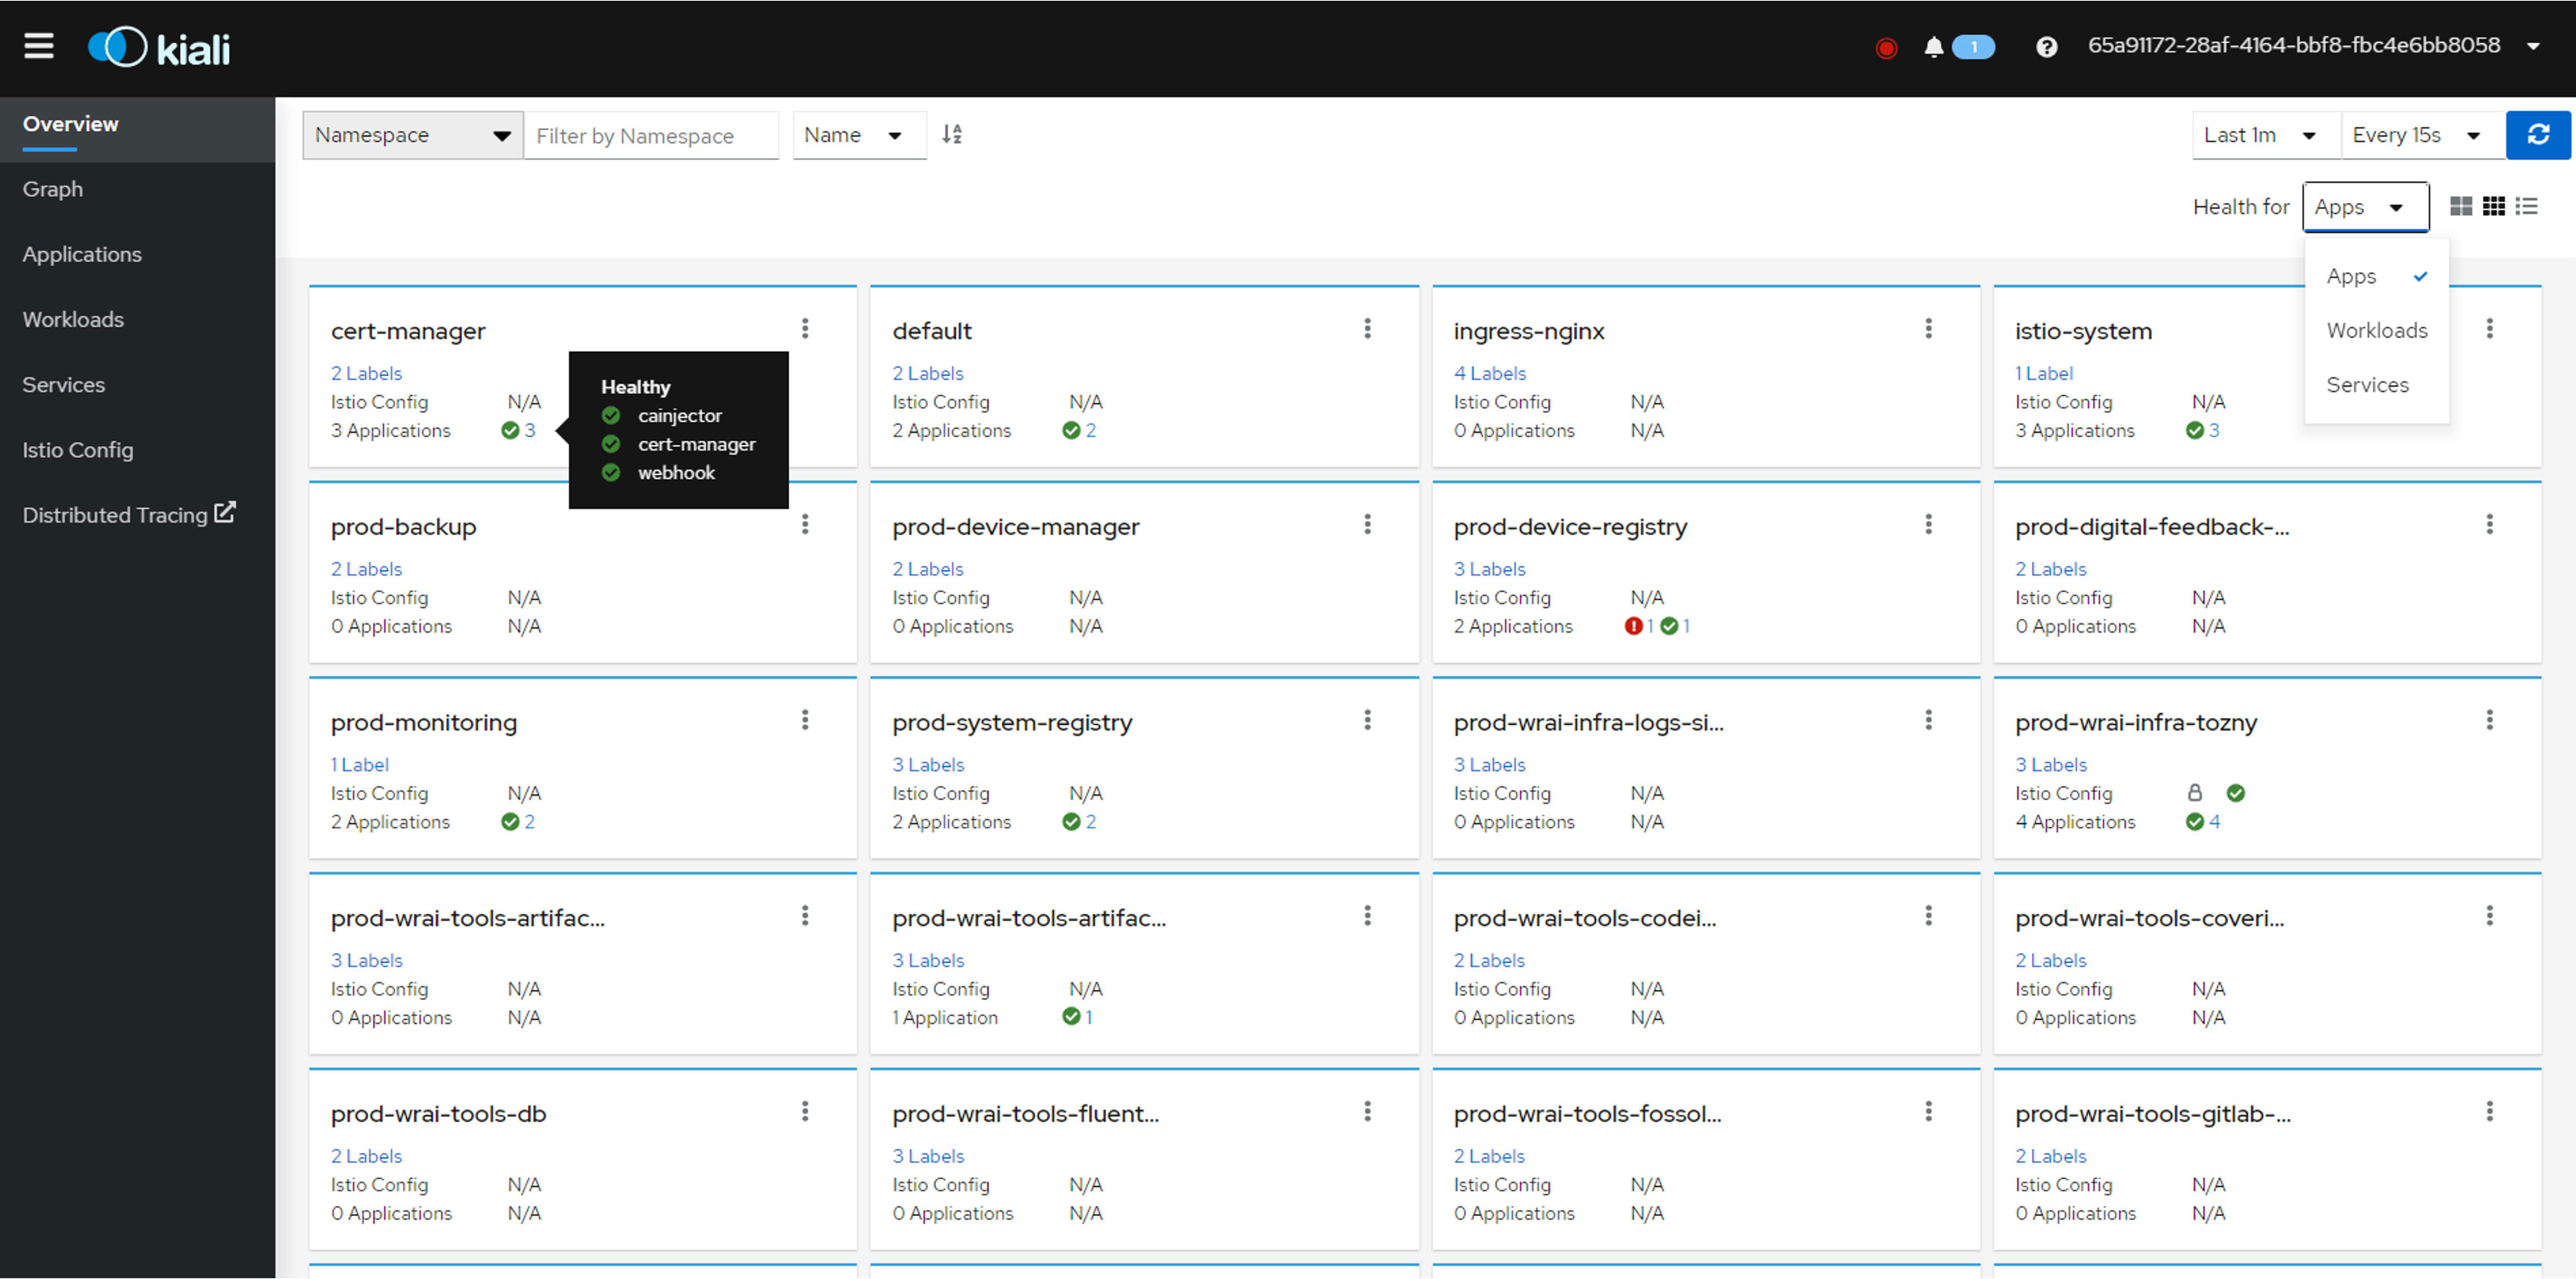
Wind River® Studio Platform Health provides dashboards that display services/components and their status over time. Administrators and editors can query each Studio component’s container/service to determine whether it is up or down.
Service Mesh
A service mesh is a dedicated infrastructure layer that, if desired, can be added to the applications. Its main characteristic is that it lets you add capabilities without adding them to the code. Examples include observability, traffic management, and security.
Event History
You can view historical data for each node and analyze performance to determine where you can reduce costs. For example, analyzing CPU usage can help you determine where a less expensive medium node can be used instead of a large node.
How It Works
Platform Health user permissions are configured in Tozny and include these roles: administrator, editor, and viewer. Authorized users such as developers and administrators on your team can visualize mesh, metrics, compute consumption, networking, and cluster operations.
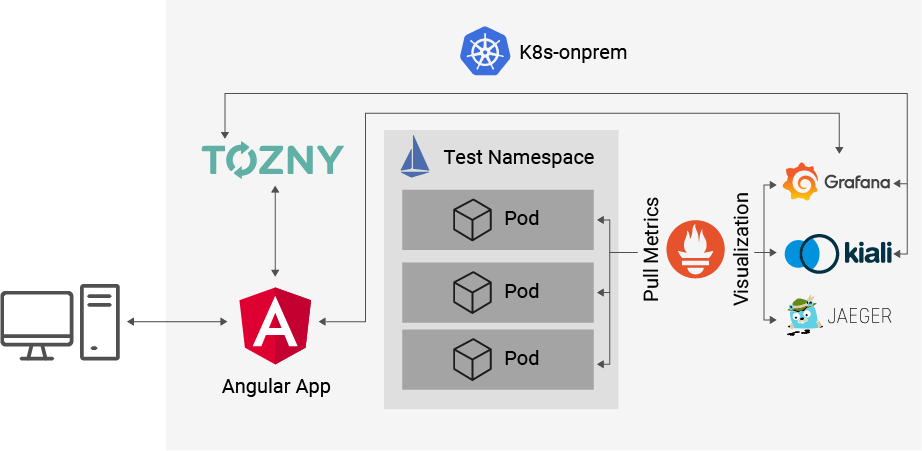
Platform Health reference architecture
A service mesh is a dedicated infrastructure layer that can be added to your Studio components. The service mesh defines the type of software and security used in the implementation by using Istio and Kiali.
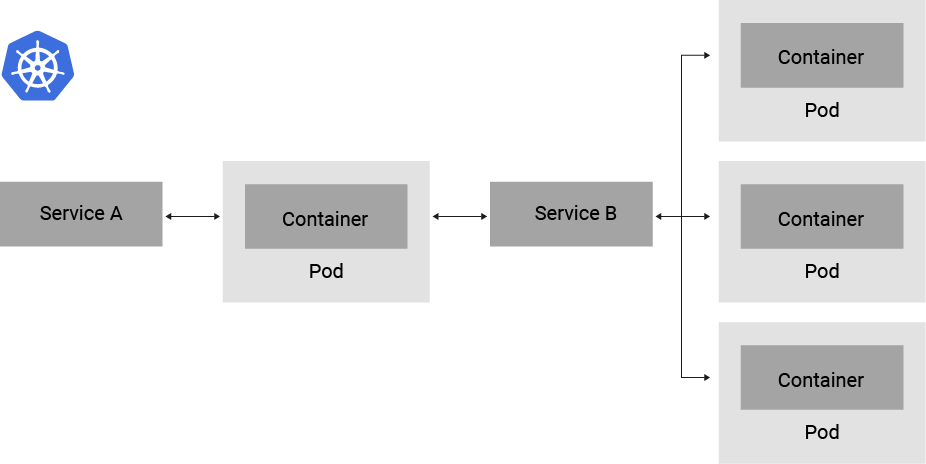
Service mesh overview
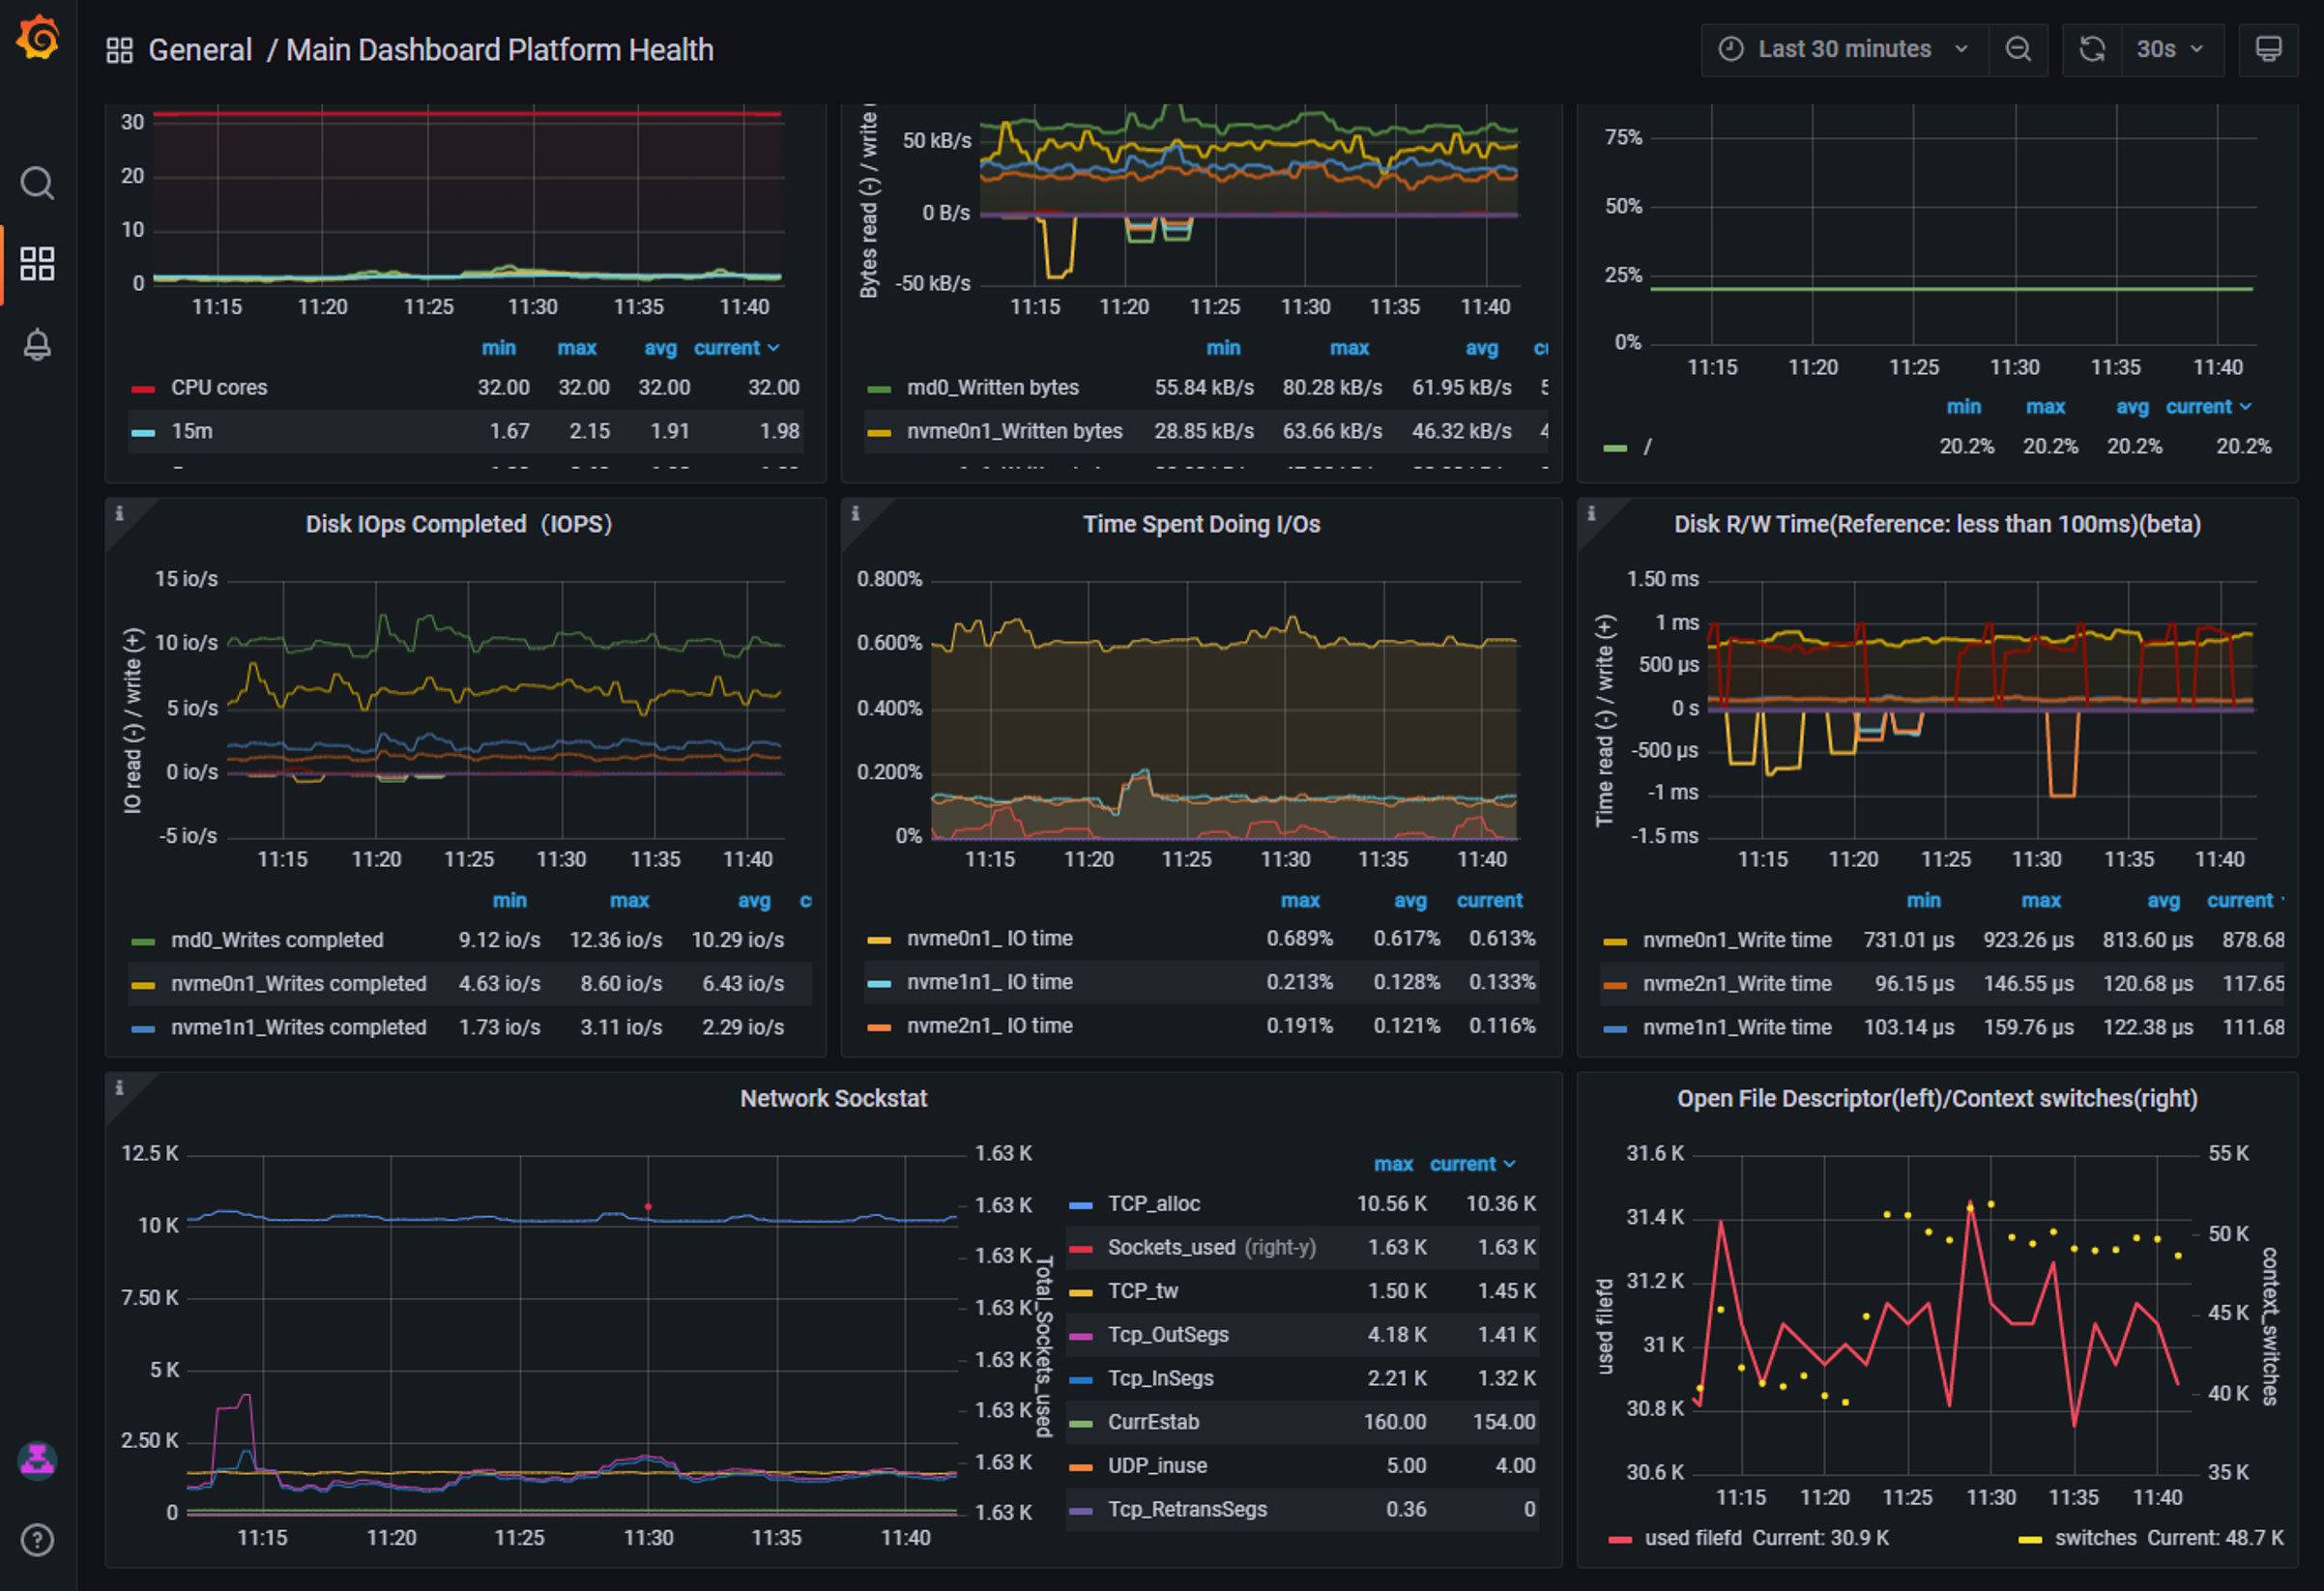
Visualize compute, networking, and resource data with Platform Health monitoring
Platform Health provides easy-to-operate, end-to-end Kubernetes cluster monitoring with Prometheus, using the Prometheus Operator. This capability is built on the Kube-Prometheus stack and includes a collection of Kubernetes manifests, Grafana dashboards, and Prometheus rules, as well as documentation.
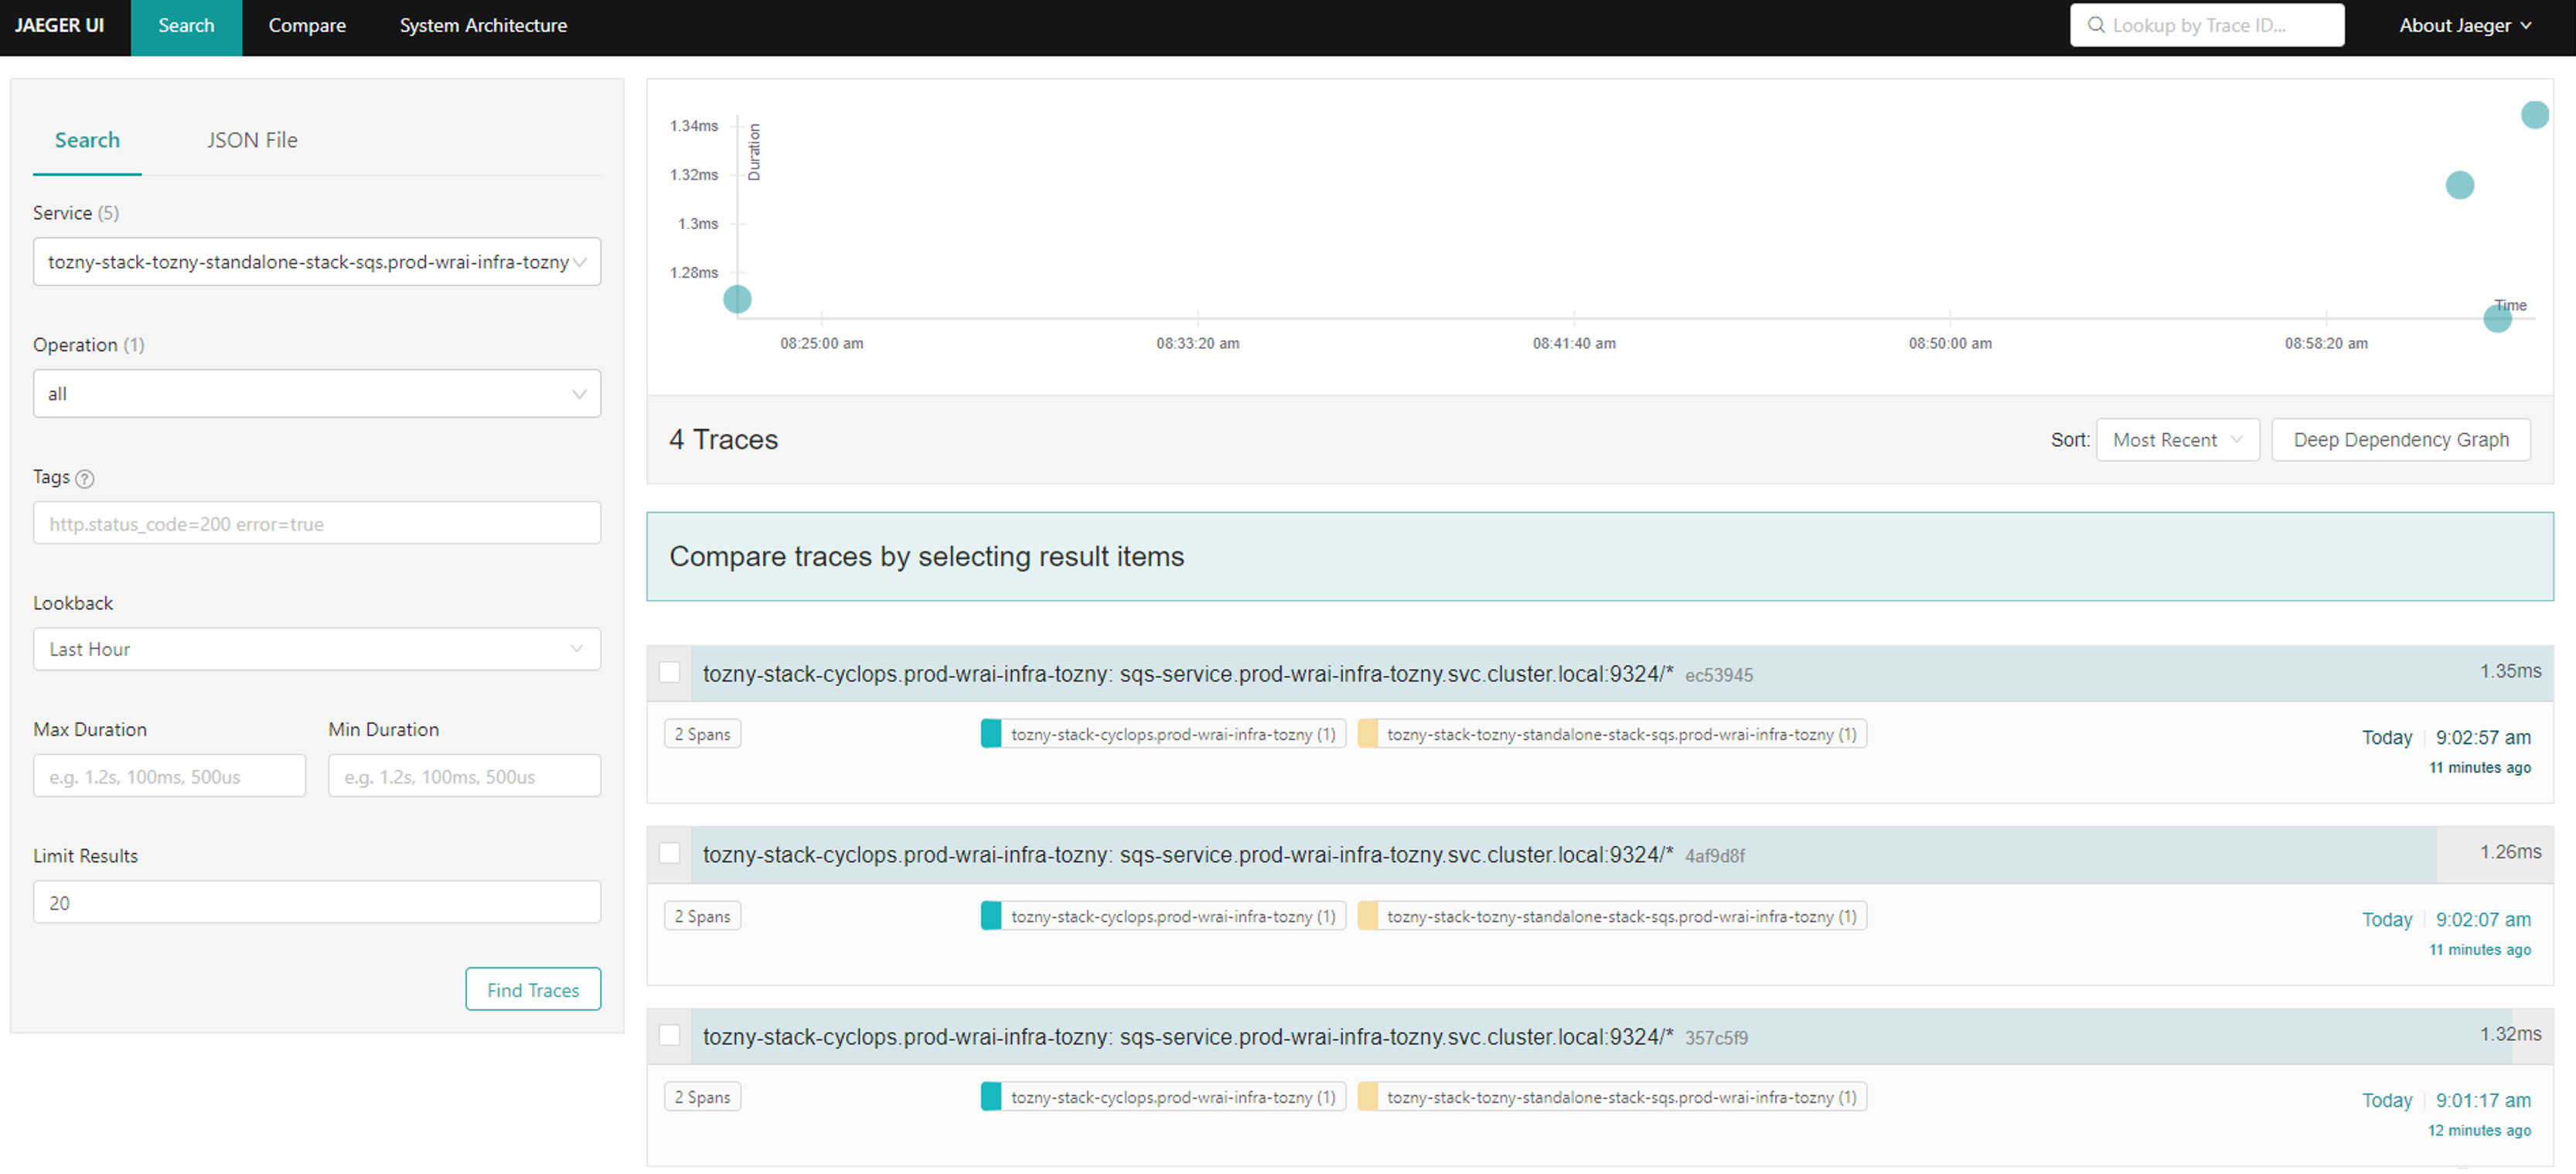
Gain insights on the entire lifecycle of a request or action across several systems
With Platform Health tracing, administrators and users can monitor and troubleshoot microservice-based distributed systems, including distributed context propagation, distributed transaction monitoring, root cause analysis, service dependency analysis, and performance/latency optimizations.
Add observability, traffic management, and security capabilities without adding code
The Platform Health service mesh allows administrators and users to visualize mesh connections traffic, view the health of services and applications, and configure routing through an intuitive UI. Additional capabilities include validation of Istio functions; visualization of security configuration; and the ability to view metrics, traces, and logs.
Platform Health Partners
Grafana allows you to query, visualize, alert on, and understand your metrics no matter where they are stored.
Istio simplifies observability, traffic management, security, and policy with the leading service mesh.
Jaeger monitors and troubleshoots transactions in complex distributed systems.
Kiali helps you understand the structure and health of your service mesh by monitoring traffic flow to infer the topology and report errors.
Prometheus records real-time metrics in a time series database built using an HTTP pull model, with flexible queries and real-time alerting.