
Wind River Studio Developer
Wind River® Studio Developer is a cloud-native, flexible DevSecOps platform that accelerates the development, testing, management, and monitoring of mission-critical embedded systems for the intelligent edge embedded software.
A Better Approach for
a Different Kind of Software
Embedded software development isn’t like standard software engineering. Physical system integration makes testing complex. Hardware is scarce. Compute and storage are constrained. And real-time performance demands attention to detail. Strict security and compliance leave no margin for error, especially in mission-critical industries.
Wind River Studio Developer simplifies this complexity. Integrated DevSecOps tools enable development, testing, and delivery of safe, high-quality embedded software.
Six Integrated Modules
Powered by Wind River Studio Developer
Each module solves a key embedded DevSecOps challenge and works seamlessly with your existing tools, OSes, and application environments. No vendor lock-in constrains your efforts.
Hover and click or let the slideshow auto rotate to see the modules in action.
Workspace

Workspace streamlines provisioning and configuration of development environments by enabling instant, on-demand creation of secure, fully configured workspaces in public or private cloud infrastructure.
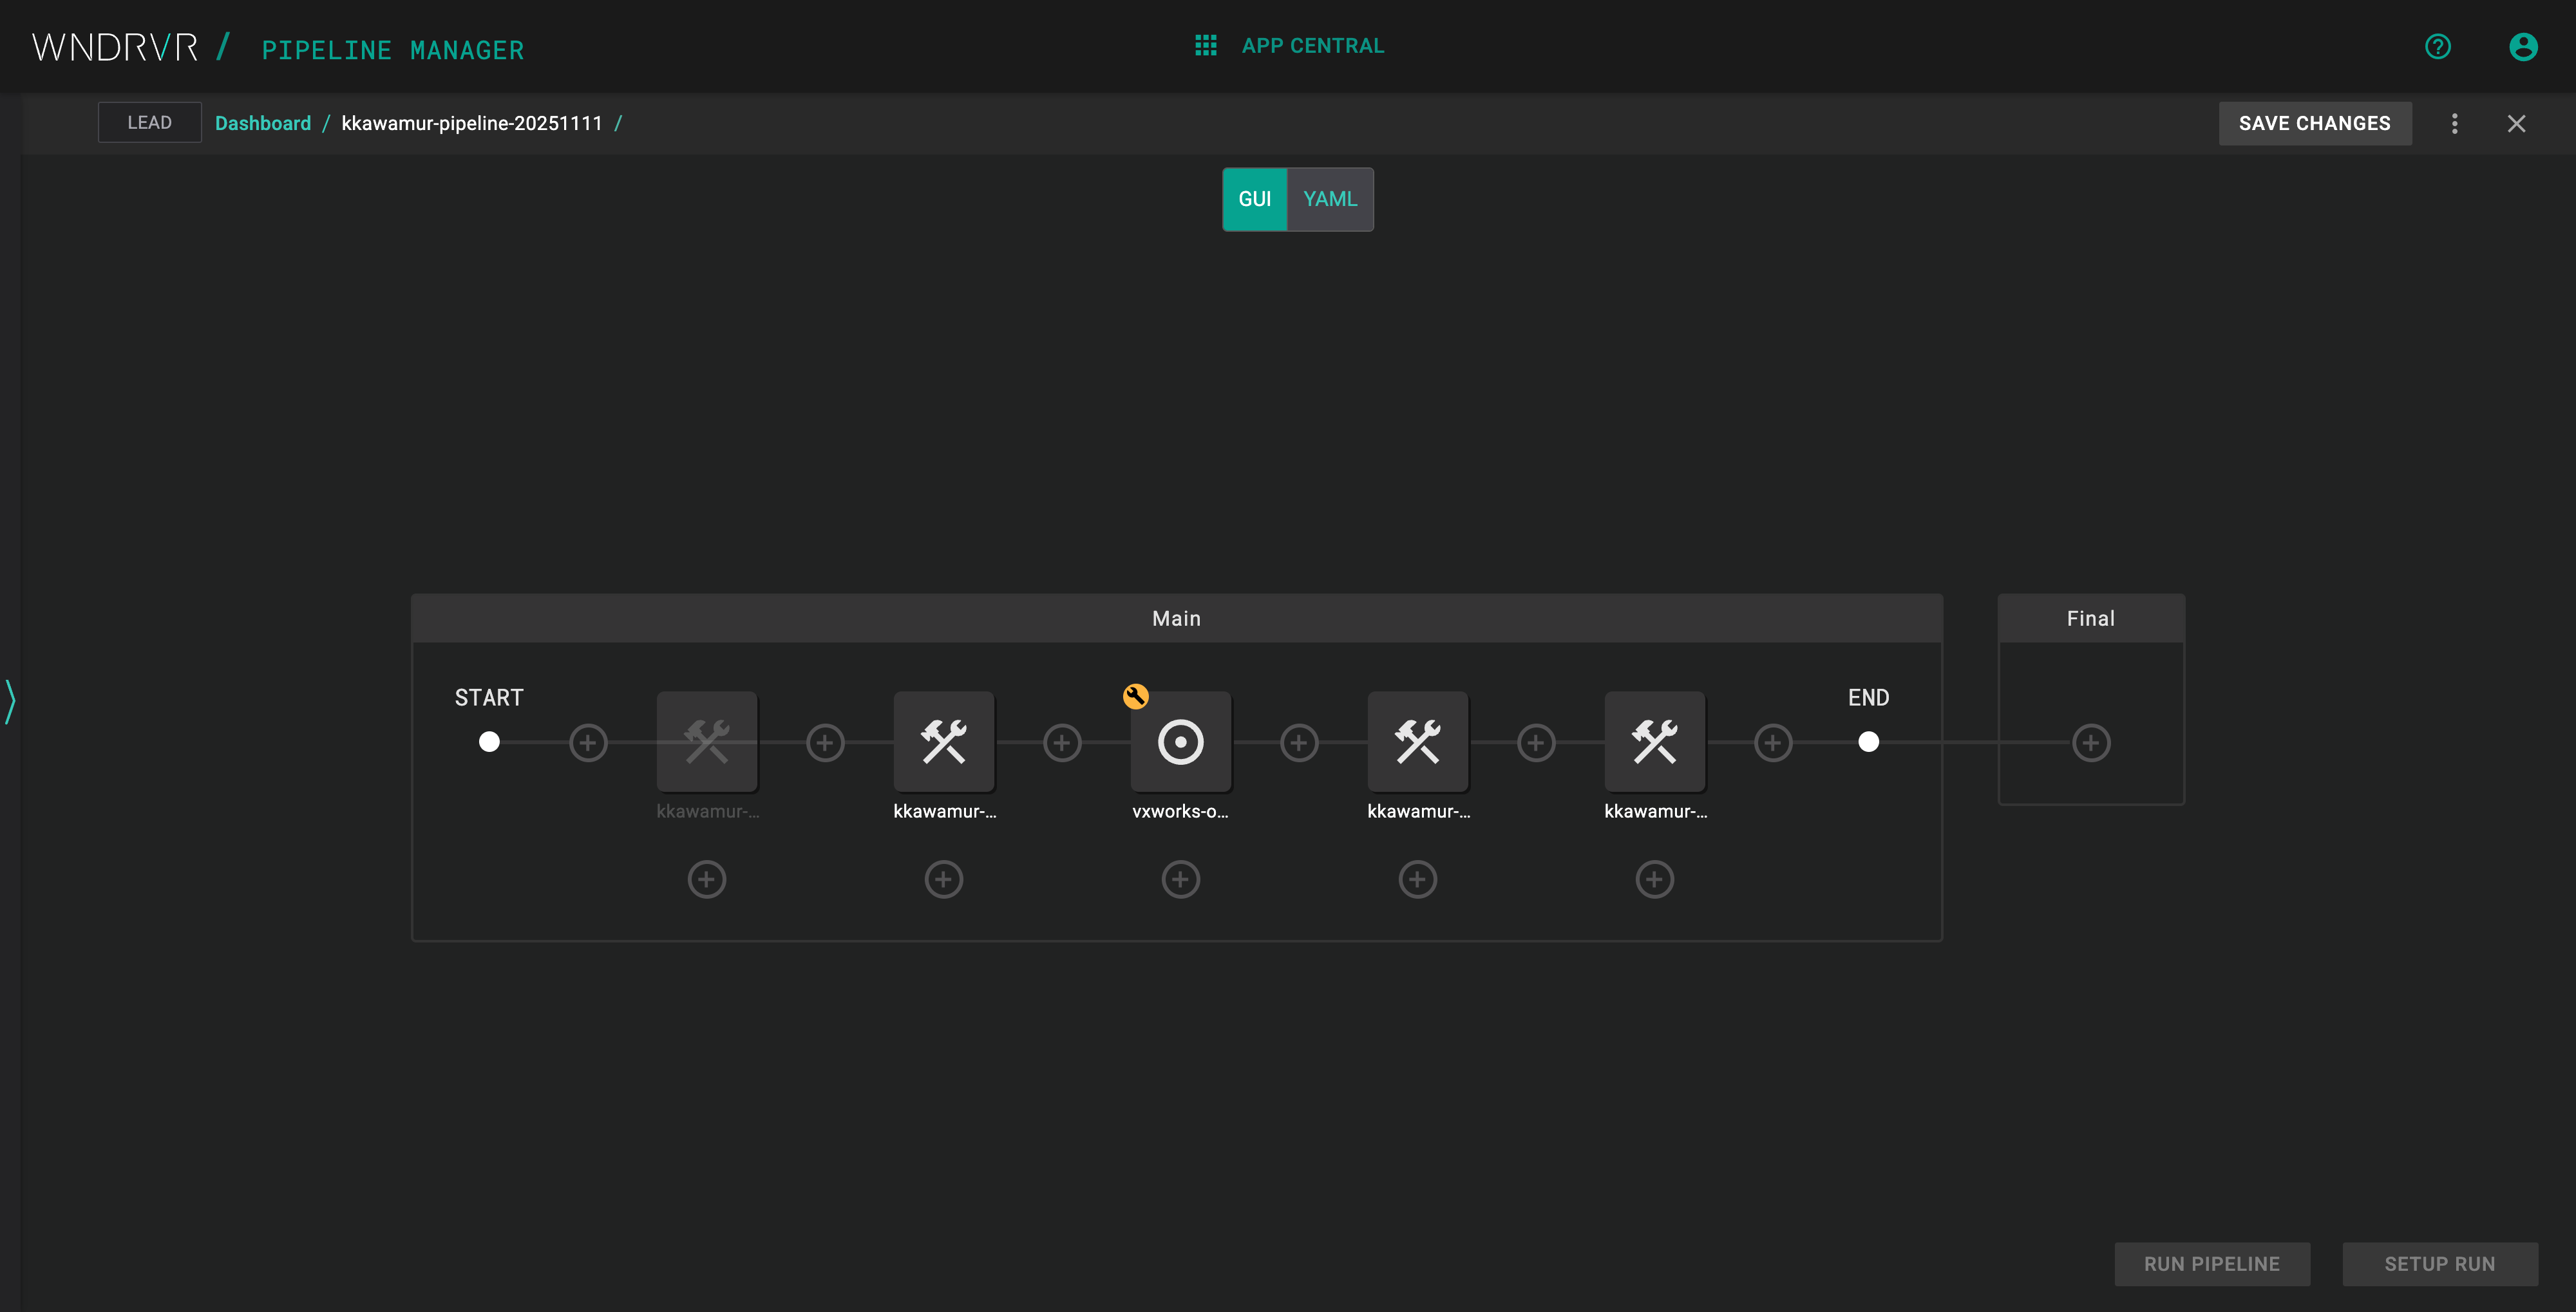
Pipeline Manager

Pipeline Manager speeds time-to-market and reduces costs by using automation and orchestration for continuous build, test, integration, and deployment.
Virtual Lab

Virtual Lab improves development schedules by securely creating virtual test environments, managing physical test devices, and sharing test resources across global teams leveraging the scalability of the cloud.
Test Automation

Test Automation simplifies and expedites the testing, verification, and validation of embedded operating system platforms and applications through cloud-hosted resources.
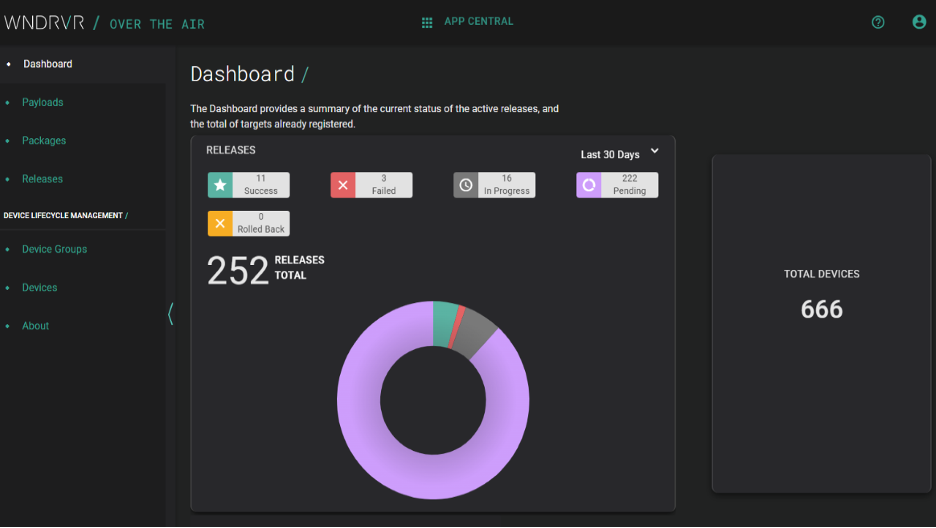
Over-the-Air Updates

Over-the-Air Updates reduces maintenance costs and increases lifetime value by orchestrating the secure, reliable delivery of software updates to widely distributed edge systems.
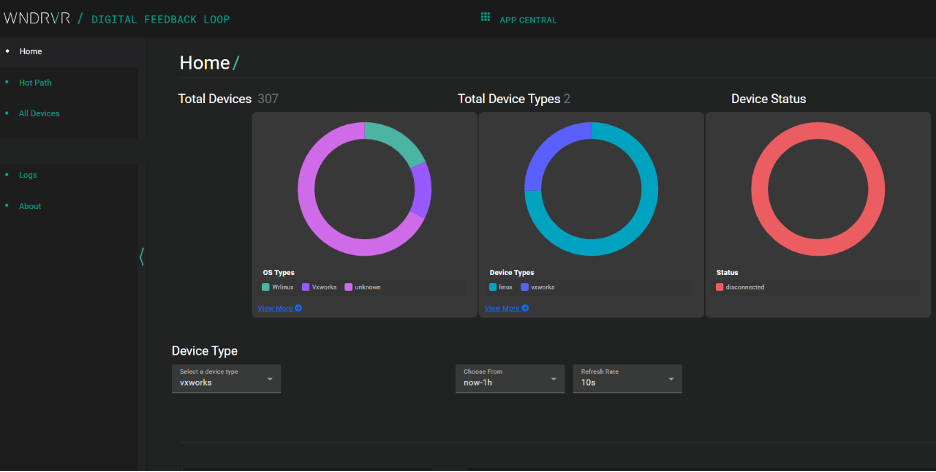
Digital Feedback Loop

Digital Feedback Loop optimizes value delivery and operational and maintenance costs with real-time analytics and insights informed by OS-level and application-specific data from the edge.
Wind River Studio Demo Tour
Take an interactive tour of some of the key capabilities in Wind River Studio. Experience for yourself Studio’s Pipelines, build systems, Virtual Lab, digital twins, and more.
Don't Need the Full Platform?
Studio Developer is flexible. Customers can adopt the full platform or choose a bundle based on their priorities. These two product bundles are ideal for teams looking to solve specific challenges in embedded software development:
Developer Efficiency Suite
Deliver safe and compliant embedded software.
Modules
- Workspace
- Pipeline Manager
- Virtual Lab
- Test Automation
Ideal for:
- Teams that need a secure, scalable, and fast delivery pipeline
- Organizations prioritizing compliance and collaboration
Developer Testing Suite
Included is everything that embedded teams need for cloud-based testing and simulation.
Modules
- Virtual Lab
- Test Automation
Ideal for:
- Teams focused on improving software quality and time-to-market
- Lightweight test setups for remote or resource-constrained environments


